
Monitoring is a broad topic in DevOps. I generally simplify it into four main categories:
Types of Monitoring#
- Passive Infrastructure Monitoring: Tracking CPU, Memory, Disk usage, Uptime, and Network I/O.
- Log Logging/Aggregation: Services stream their logs to a central system (ELK, Loki) where you can set alerts on specific patterns (e.g., “Exception”).
- Active Monitoring (Synthetics): Pinging your servers on a timer for aliveness/health, or performing full verification of API endpoints.
- Application Performance Monitoring (APM): Metrics gathered through code injection/instrumentation to view application-level performance (e.g., function execution time, DB query latency).
Why Passive Monitoring Matters#
The focus of this post is passive monitoring. Unless your career depends on things working 100% of the time, you probably don’t want to constantly second-guess yourself or have to manually check if your services or applications are running.
Real-World Example: Trading Bot reliability#
While working on my trading bot, I often found that some microservices would crash silently. This isn’t a huge issue with orchestrators like Docker Compose or Kubernetes, as the service will simply be restarted automatically.
However, repeated restarts are a symptom of a deeper problem. Microservices shouldn’t just “turn off and on again” constantly.
The question becomes: How would I know if services were restarted 50 times last night?
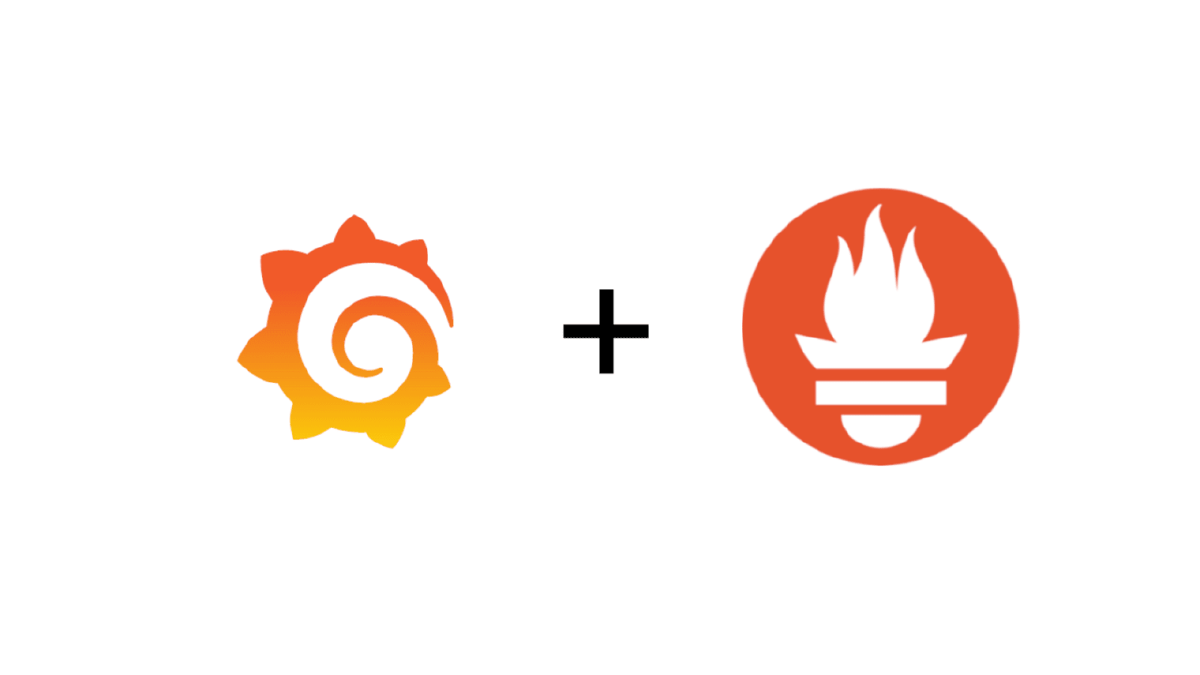
The Solution: Prometheus + AlertManager#
One approach is to check Docker logs or kubectl get pods manually, but that’s not practical—especially from a phone while at dinner.
The Better Approach: Prometheus with AlertManager. It can inform me that my services are unstable (flapping) or not behaving as expected, prompting me to check the logs to debug further.
Key Use Cases#
Performance Monitoring:
- If your application becomes unstable during high load, you want to be alerted if CPU usage spans >90% or memory is exhausted (OOM Kill).
- Identifying bottlenecks to determine if you need to scale vertically (bigger server) or optimize code.
- Tooling:
node_exporteris excellent for exporting Linux machine metrics to Prometheus.
Service Health:
- Automatic Restart Detection: Alert if uptime < 10 minutes.
- Service Availability: Alert if a scrape target is down.
- Resource Utilization: catch memory leaks before they crash the server.
- Network Connectivity: Monitor latency and packet loss between services.
Implementation Benefits#
- Proactive: Catch issues before they impact users.
- Remote: Monitor from anywhere via mobile alerts (Slack/PagerDuty).
- Automated: No manual checking required; the system watches itself.
- Scalable: Works across multiple services and environments without extra effort.
Bottom line: If you don’t have passive monitoring yet, you’re flying blind and wasting time on manual checks that could be automated.