
During my engineering co-op at Grin Technologies (ebikes.ca), I served as the lead developer for the EV Trip Analyzer, a web platform for scrutinizing electric bicycle performance data.
Functionality#
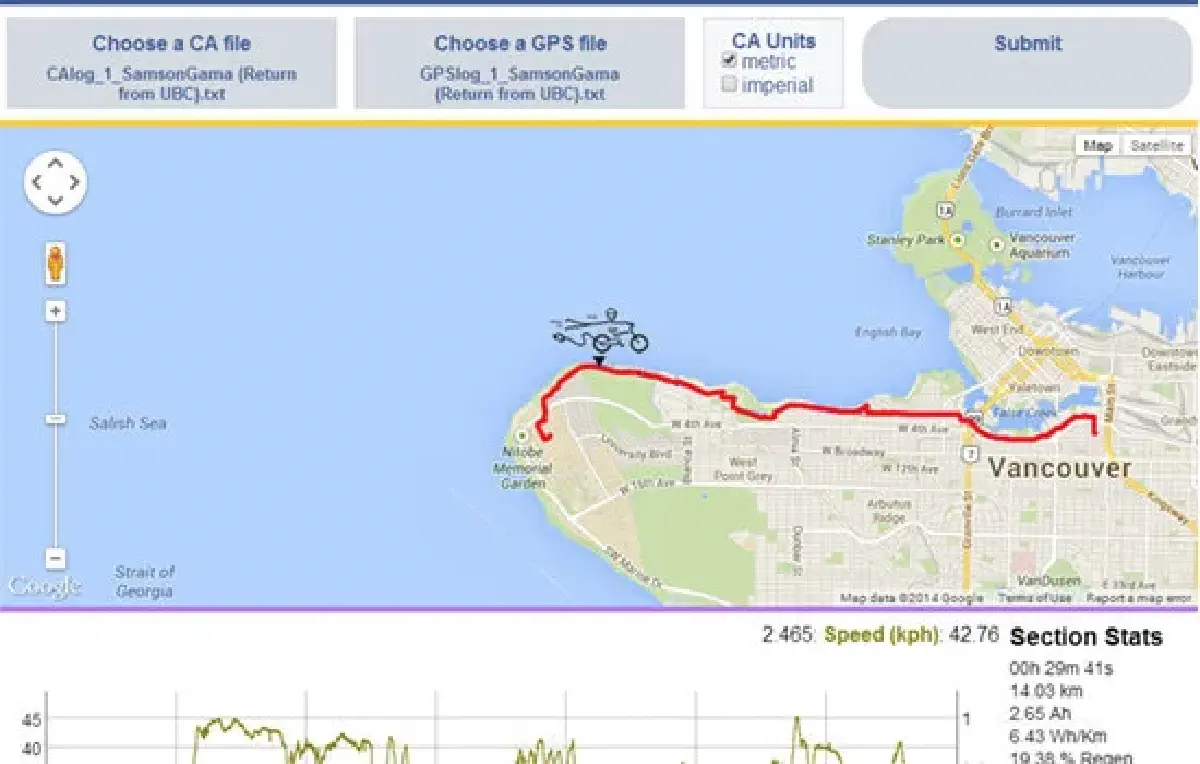
The application parses raw telemetry logs (analog and digital) outputted by the Cycle Analyst hardware. It transforms this data into interactive insights:
- Performance Metrics: Plots Speed, Power (Watts), Efficiency (Wh/km), and Regenerative Braking data against Time or Distance.
- Geospatial Analysis: Overlays trip data onto a Google Maps route, allowing users to correlated energy consumption with elevation changes.
- Sharing: Implemented a trip upload feature that generates permalinks for community sharing.
Technology Stack#
- Core: HTML5, CSS3, PHP, JavaScript (jQuery).
- Compression: LZ-String for efficient client-side compression/decompression of large telemetry datasets.
- Visualization: DyGraphs for high-performance time-series plotting.
- Mapping: Google Maps JavaScript API.
Try it out here: http://www.ebikes.ca/tools/trip-analyzer.html